Yuanzhen Lin
菜单
置顶

ggplot2绘制带概率或显著性的相关矩阵的热图

作者:林元震

相关矩阵的热图为何带概率或显著性

  • 使得热图更有统计学意义;
  • ggplot2能否实现这种图形。

ggplot2中热图的基础绘图方法如下:
ggplot(data, aes(x=,y=, fill=))+ geom_tile()
其中data代表数据集,aes代表数据映射,x代表变量名,y代表变量名或样本号,fill参数为数值型变量,geom_tile代表几何对象为瓦片图。

ggplot2不能直接绘制热图,需要做数据变换,最后的数据格式保留为3列,分别是变量名、样本号(或变量名)和数值,再分别映射给x、y和fill参数。此外,不同变量直接的数值差异较大,所以通过scale()对所有变量的数值标准化。这样就可降低值差,给图例一个更合理的色域,也利于图形美观。

数据读取与融合

 1
 2
 3
 4
 5
 6
 7
 8
 9
10
11
12
13
14
15
16
17
18
19
20
21
22
23
24
25
26
27
28
29
30
31
32
33
34
35
36
37
38
39
40
41
42
43
44
45
46
47
data(d8.1.6,package='RSTAT2D')
mydata <- d8.1.6[,-1]
tdd <- as.data.frame(scale((mydata)))
head(tdd)
##            h        dbh            v        str         wd          tw
## 1 -0.7771651  0.1508848 -0.611934185  0.7352031 -0.5350928 -0.57061982
## 2 -0.4637808  0.1508848 -0.346070351  0.7352031 -0.5350928 -0.57061982
## 3  0.4260068  0.4495434 -0.918700148 -1.1221521 -0.7830405 -0.99018209
## 4  0.8904872  0.2172534  0.001597739 -1.1221521 -0.5350928  0.22009369
## 5 -0.4637808 -0.2307345  0.226559445 -0.5030337  0.4129422  1.04308123
## 6  1.3269868 -0.3302874  0.247010509 -1.1221521 -0.6080186 -0.04616698
##        larea        dis         lt
## 1  0.5675137 -0.8680278  1.1899014
## 2  0.5675137 -0.8680278  1.1899014
## 3  0.4739996  1.1160357  1.1899014
## 4 -0.9661175  1.1160357 -0.8141431
## 5 -0.8351978 -0.8680278 -0.8141431
## 6 -1.5646078  1.1160357 -0.8141431

tdd$Prov=d8.1.6$Prov
head(tdd)
##            h        dbh            v        str         wd          tw
## 1 -0.7771651  0.1508848 -0.611934185  0.7352031 -0.5350928 -0.57061982
## 2 -0.4637808  0.1508848 -0.346070351  0.7352031 -0.5350928 -0.57061982
## 3  0.4260068  0.4495434 -0.918700148 -1.1221521 -0.7830405 -0.99018209
## 4  0.8904872  0.2172534  0.001597739 -1.1221521 -0.5350928  0.22009369
## 5 -0.4637808 -0.2307345  0.226559445 -0.5030337  0.4129422  1.04308123
## 6  1.3269868 -0.3302874  0.247010509 -1.1221521 -0.6080186 -0.04616698
##        larea        dis         lt    Prov
## 1  0.5675137 -0.8680278  1.1899014 Prov001
## 2  0.5675137 -0.8680278  1.1899014 Prov002
## 3  0.4739996  1.1160357  1.1899014 Prov003
## 4 -0.9661175  1.1160357 -0.8141431 Prov004
## 5 -0.8351978 -0.8680278 -0.8141431 Prov005
## 6 -1.5646078  1.1160357 -0.8141431 Prov006

# 使用reshape2的melt()进行数据融合
mdd <- reshape2::melt(tdd)

head(mdd)
##      Prov variable      value
## 1 Prov001        h -0.7771651
## 2 Prov002        h -0.4637808
## 3 Prov003        h  0.4260068
## 4 Prov004        h  0.8904872
## 5 Prov005        h -0.4637808
## 6 Prov006        h  1.3269868

1 常规热图绘制

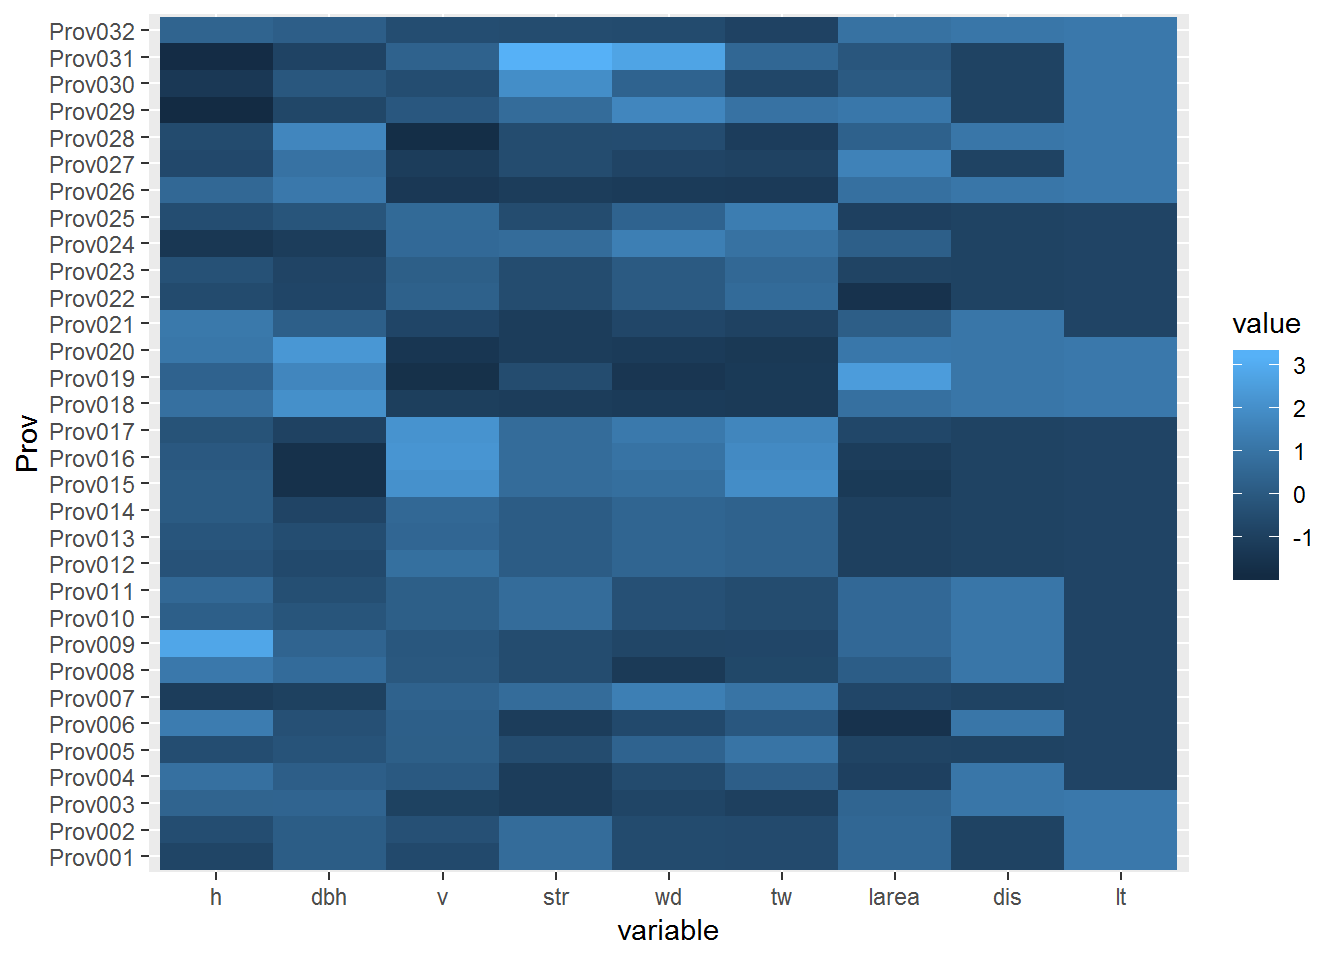
默认的热图见Figure @ref(fig:h1):

1
    (pheat=ggplot(data = mdd, aes(x=variable, y=Prov, fill=value))+geom_tile())

默认heatmap图

默认heatmap图

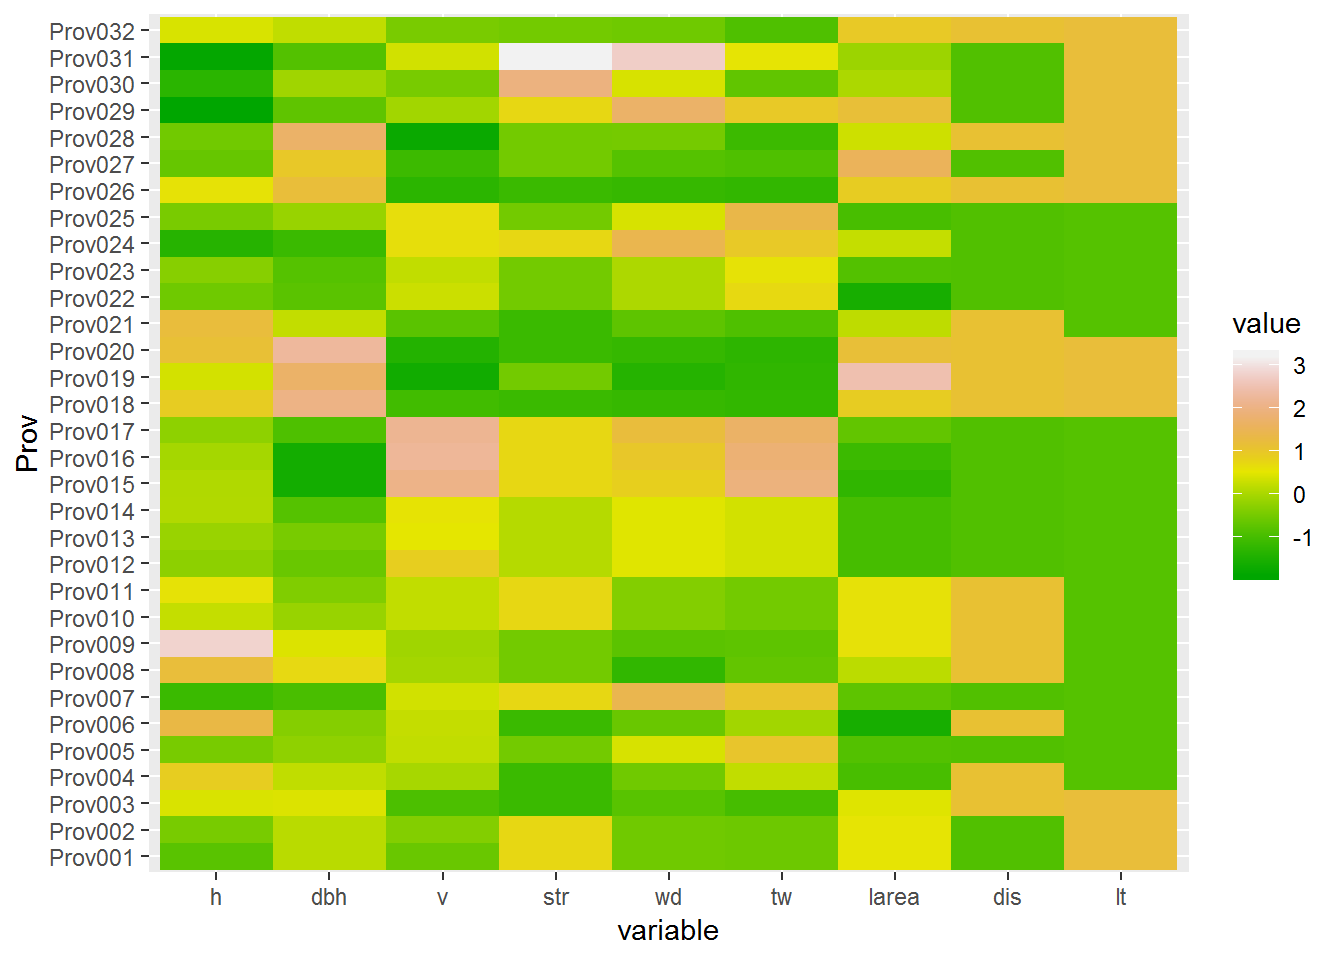
由于采用默认的填充色,色差较小,热图效果不好,这时可设置渐变色来加以调整。

1
    pheat+ scale_fill_gradientn(colours = terrain.colors(20))

heatmap图-修改色差

heatmap图-修改色差

2 常规相关图绘制

ggplot2中相关图的绘图方法如下:
ggplot(data, aes(x=,y=, fill=))+ geom_tile()
其中data代表数据集,aes代表数据映射,x代表变量名,y代表变量名,fill参数为数值型变量,geom_tile代表几何对象为瓦片图。

1
2
3
4
5
6
    mcor <- round(cor(mydata),2)

    cormat <- melt(mcor)

    (pcorr=ggplot(data = cormat, aes(x=Var1, y=Var2, fill=value)) + 
      geom_tile()+scale_fill_gradient2(low="darkred", high="darkgreen"))

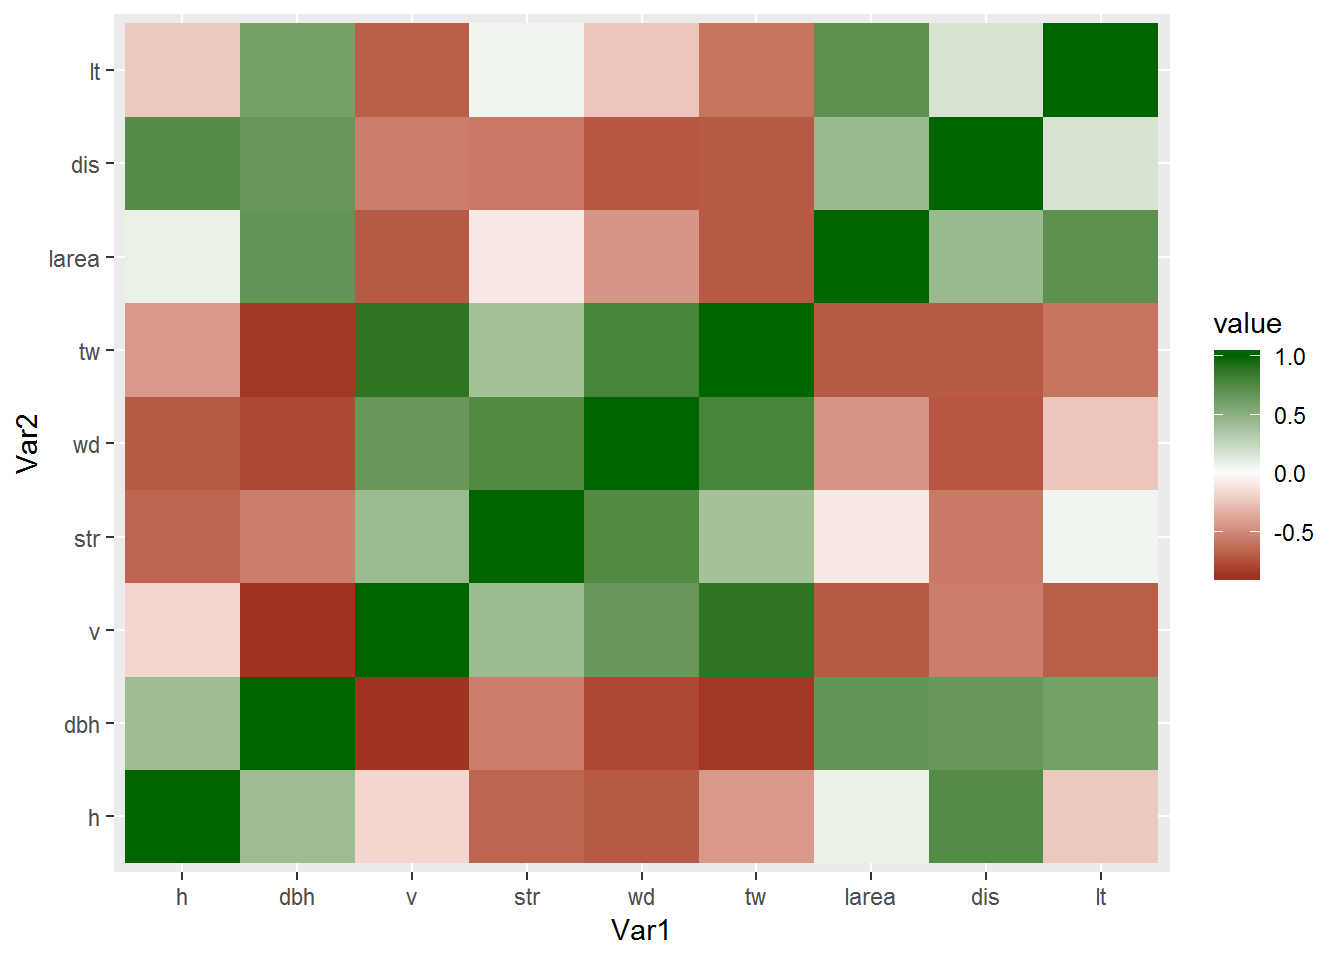
默认相关图

默认相关图

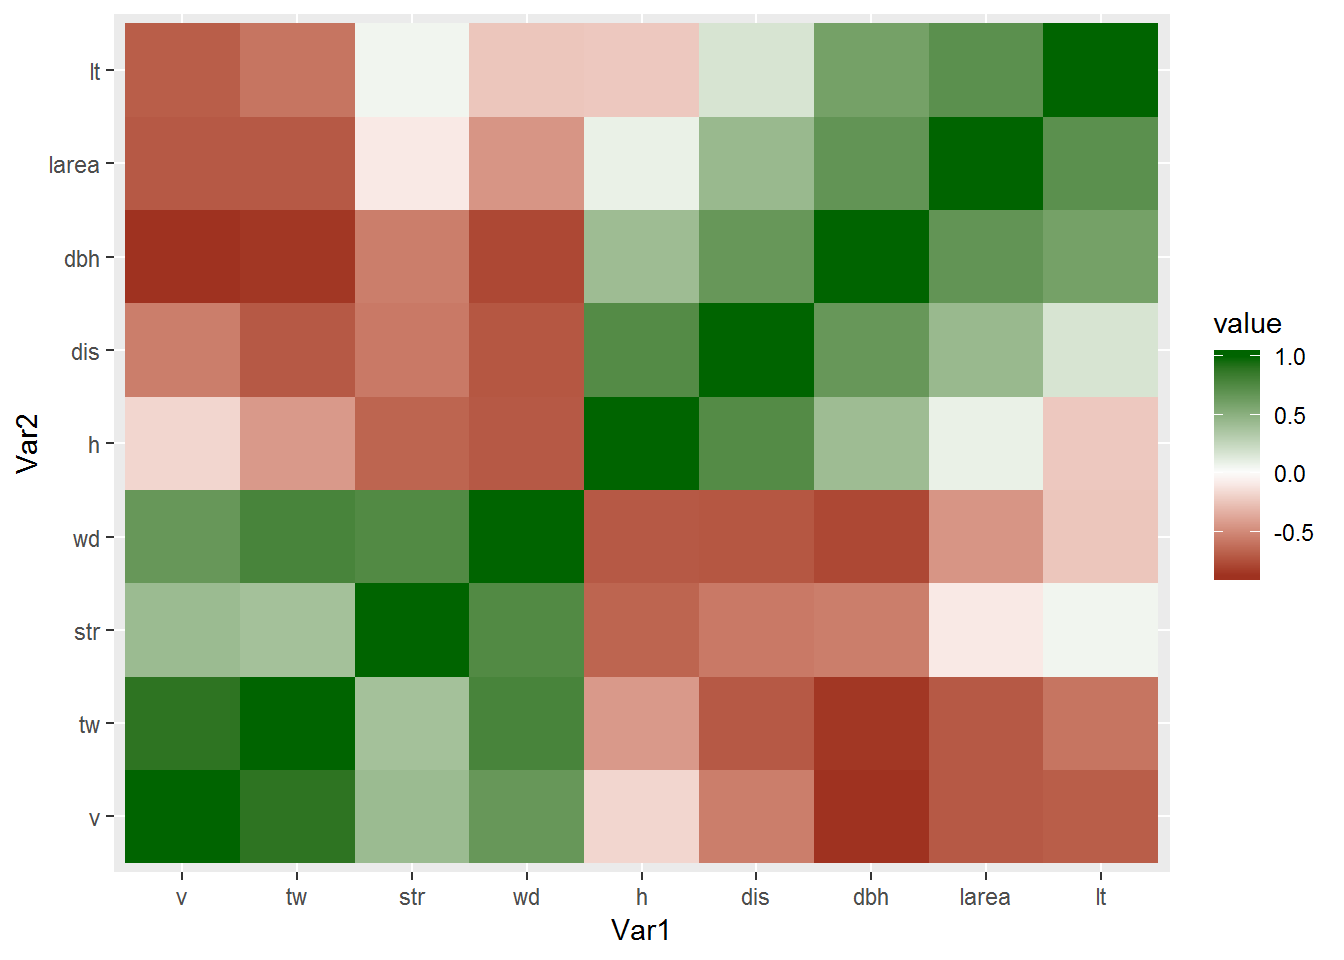
从生成的相关图看出,相关值正负排列比较混乱,因此可以对相关矩阵进行重排序(自定义函数),然后再绘制相关图。

1
2
3
4
5
6
7
8
9
    reorder_cormat <- function(cormat){
      dd <- as.dist((1-cormat)/2)
      hc <- hclust(dd)
      cormat <-cormat[hc$order, hc$order]
    }
    mcor1=reorder_cormat(mcor)
    cormat1 <- melt(mcor1)

    pcorr %+% cormat1

相关图-聚类排序

相关图-聚类排序

3 将热图与相关图合在一起

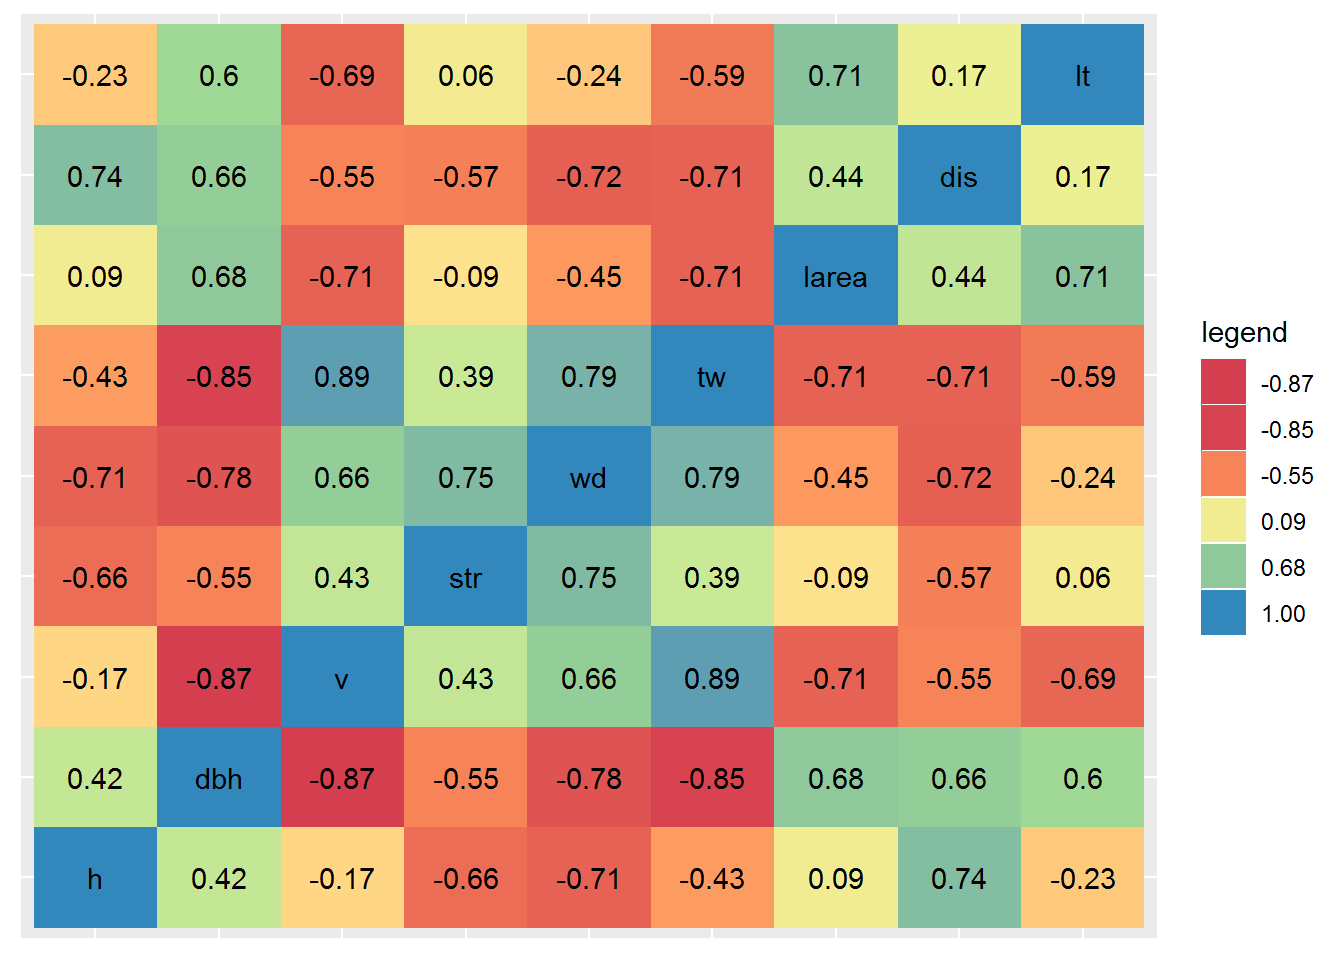
ggplot2不能直接绘制热图与相关图的结合图,这时,可以自行编程heatmap1()来实现。具体代码见本文的最后。

1
    heatmap1(mydata,type='data',Sig=FALSE,Nbreaks = 8)

heatmap相关图

heatmap相关图

注:Nbreaks控制图例的显示数量。

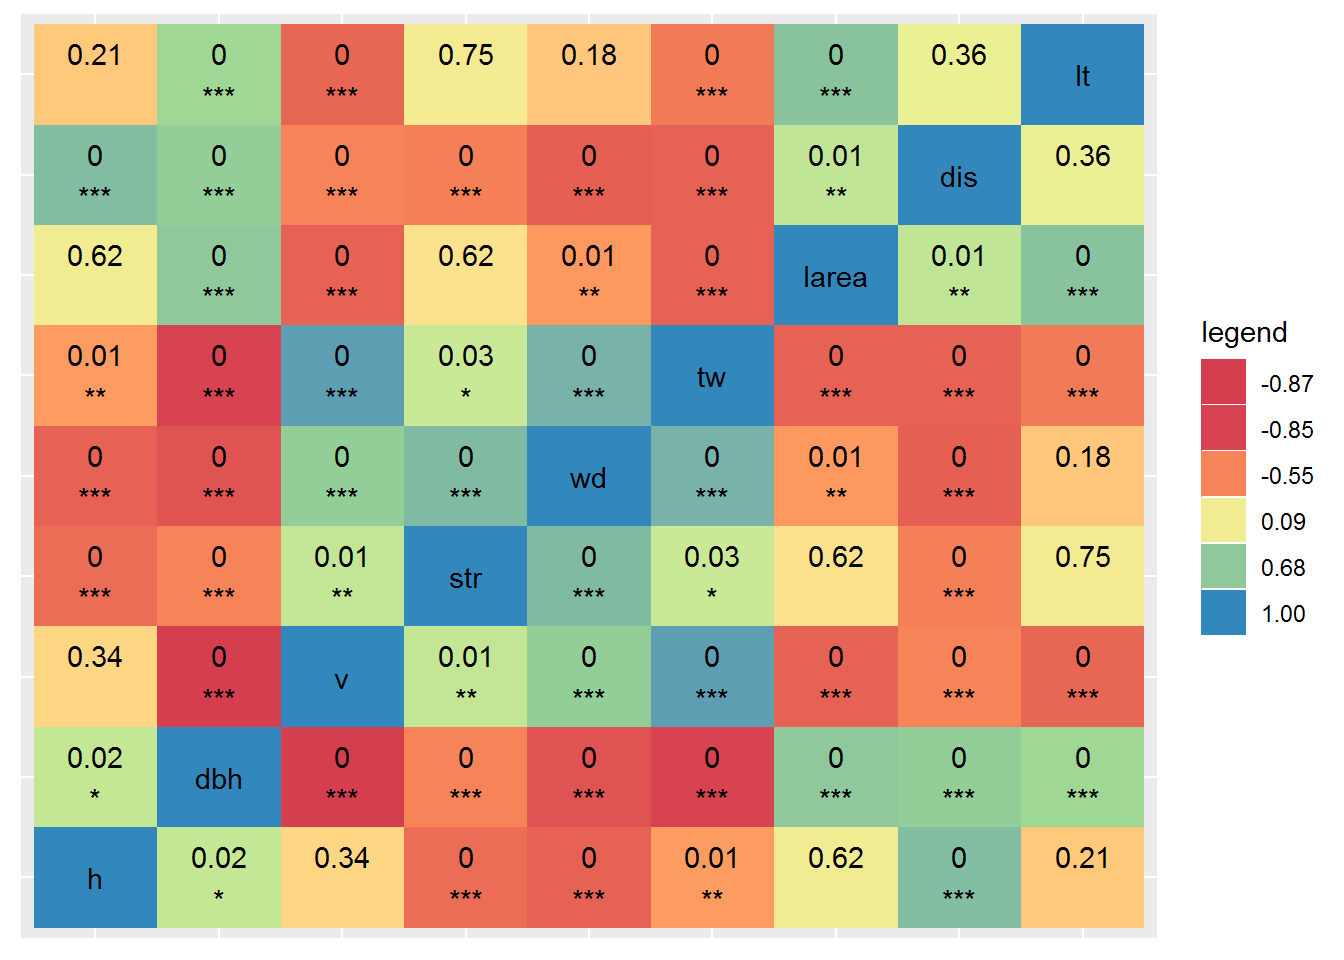
将p值和显著性添加到图形中。

1
    heatmap1(mydata,type='data',Sig=TRUE,Nbreaks = 8)

heatmap相关图-p值和显著性

heatmap相关图-p值和显著性

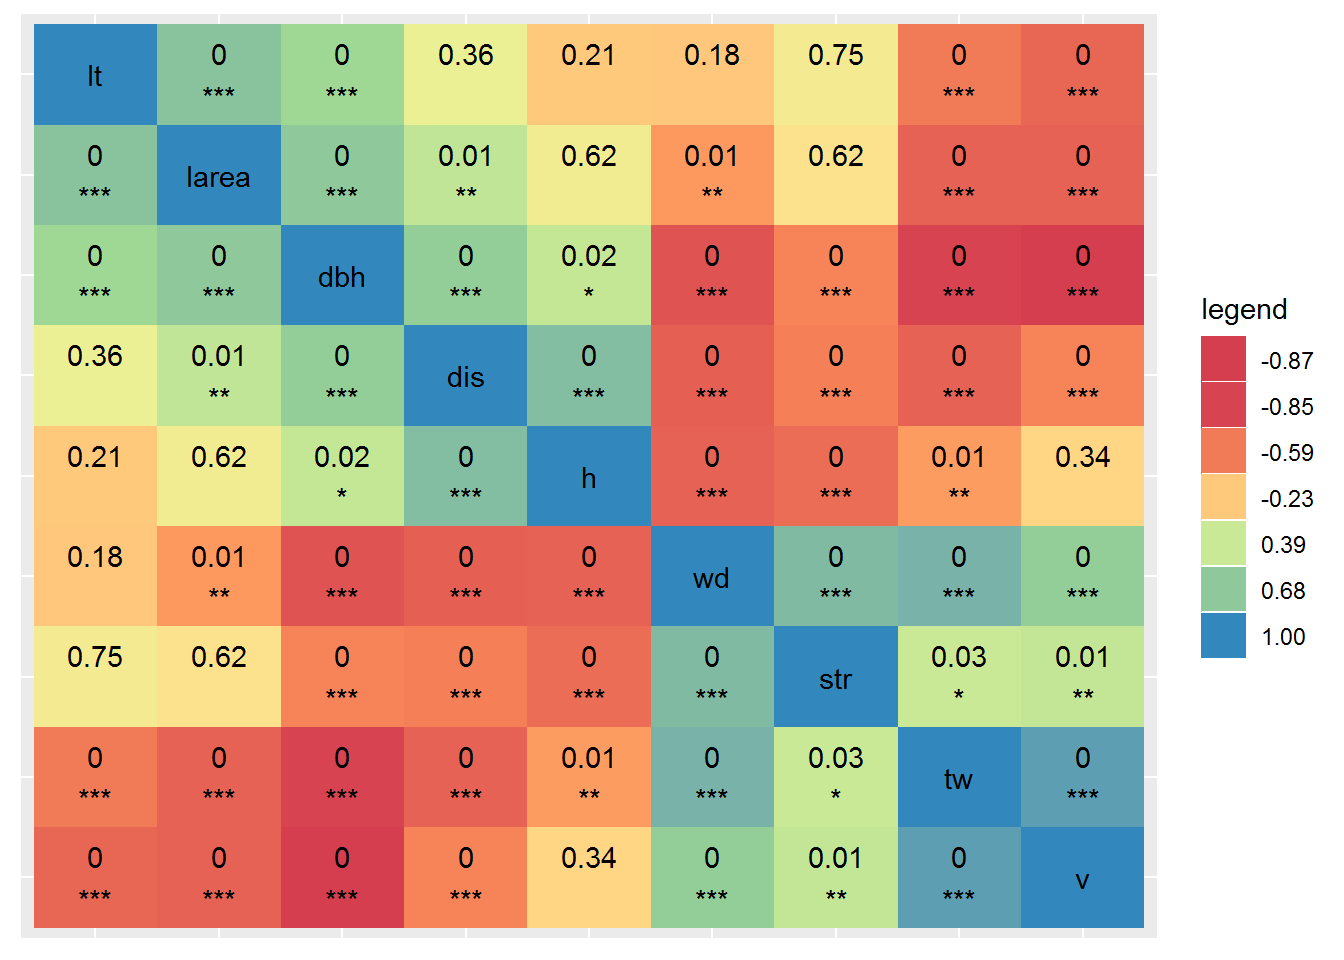
现在对相关矩阵进行聚类排序。

1
    heatmap1(mydata,type='data',Sig=TRUE,order=TRUE,Nbreaks = 6)

heatmap相关图-p值和显著性-聚类排序

heatmap相关图-p值和显著性-聚类排序

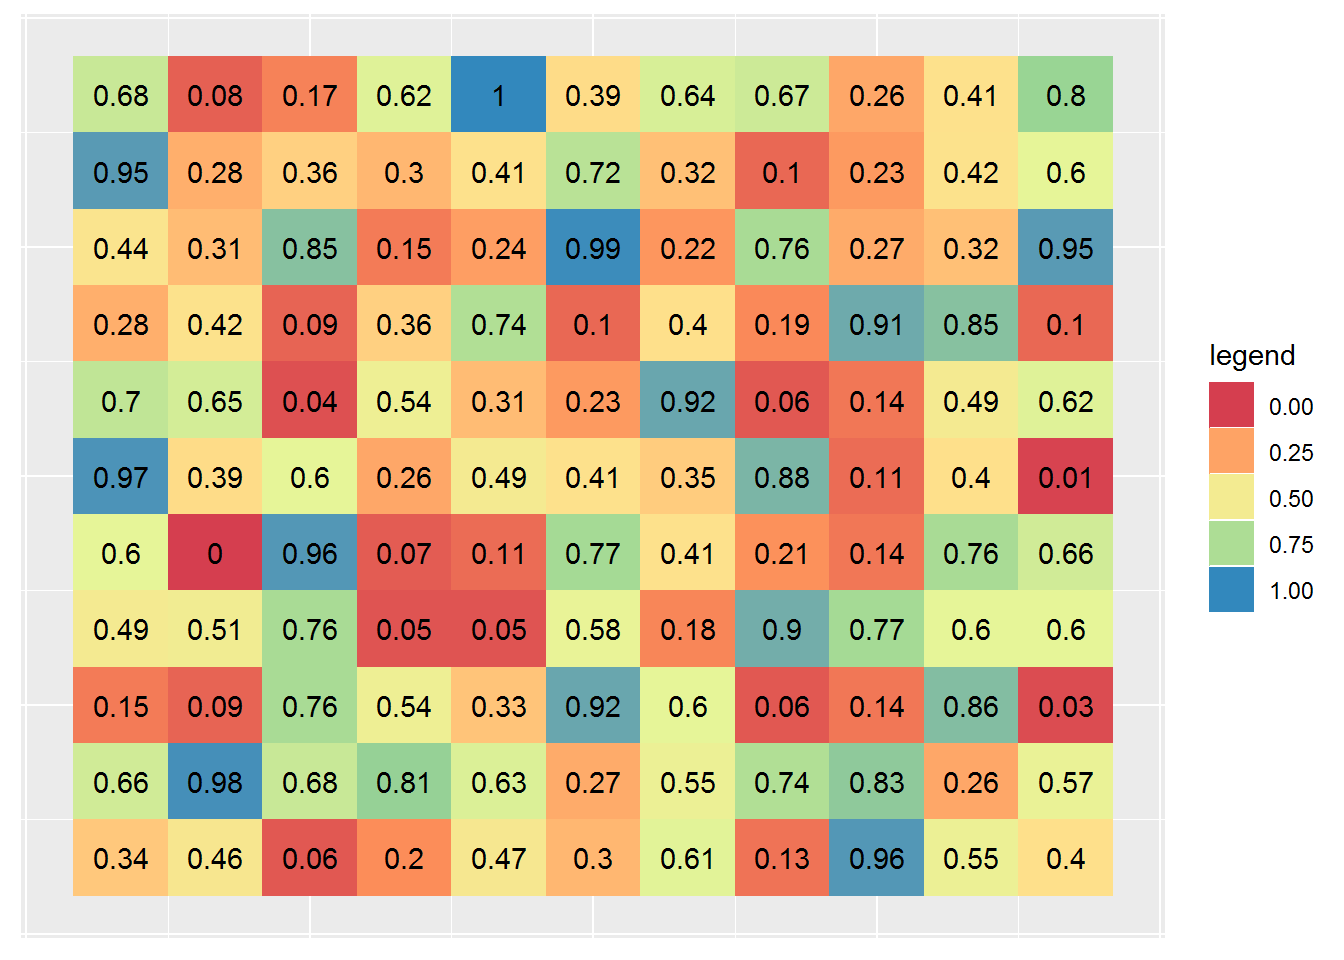
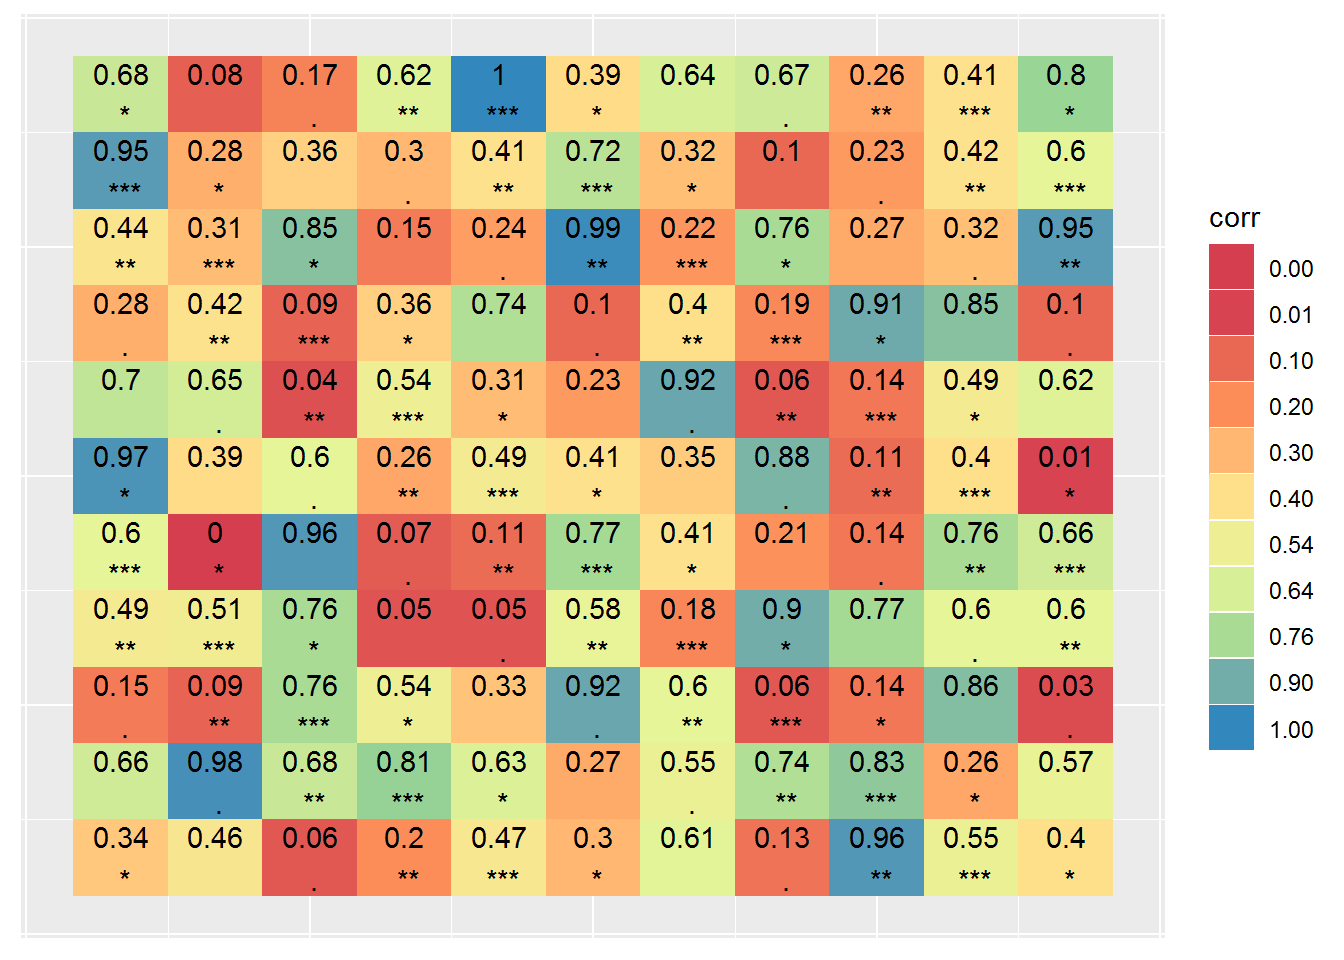
事实上,除了数据集和相关矩阵,heatmap1()函数可以绘制任意矩阵和代标签的另一个矩阵,下述举一个简单的例子,当然读者应当明白下述例子没有什么科学意义。

1
2
3
4
5
6
    set.seed(2018)
    # 生成11×11的随机值矩阵label
    label<-matrix(runif(121),nrow=11)
    label<-round(label,2)

    heatmap1(label)

heatmap1随意矩阵图

heatmap1随意矩阵图

 1
 2
 3
 4
 5
 6
 7
 8
 9
10
11
12
13
14
15
16
17
18
19
20
    # 两个矩阵的粘贴
    matrix.ps<-function(a,b){
      # matrix a and b should have the same dim
      N=nrow(a)#=nrow(b)
      a=round(a,2) # matrix a must be numeric
                   # matrix b should be character
      c=matrix(0,nrow=N,ncol=N)
      for(i in 1:N){
        for(j in 1:N) c[i,j]=paste(a[i,j],b[i,j],sep='\n ')
      }
      return(c)
    }

    sig<-c('*','','.','**','***')
    b<-matrix(sig,nrow=11,ncol=11)

    # 生成标签矩阵
    label2<-matrix.ps(label,b)
    heatmap1(label,type='matrix',df.label=label2,
            gtitle='corr',Nbreaks = 8)

heatmap1随意矩阵图及其标签矩阵

heatmap1随意矩阵图及其标签矩阵

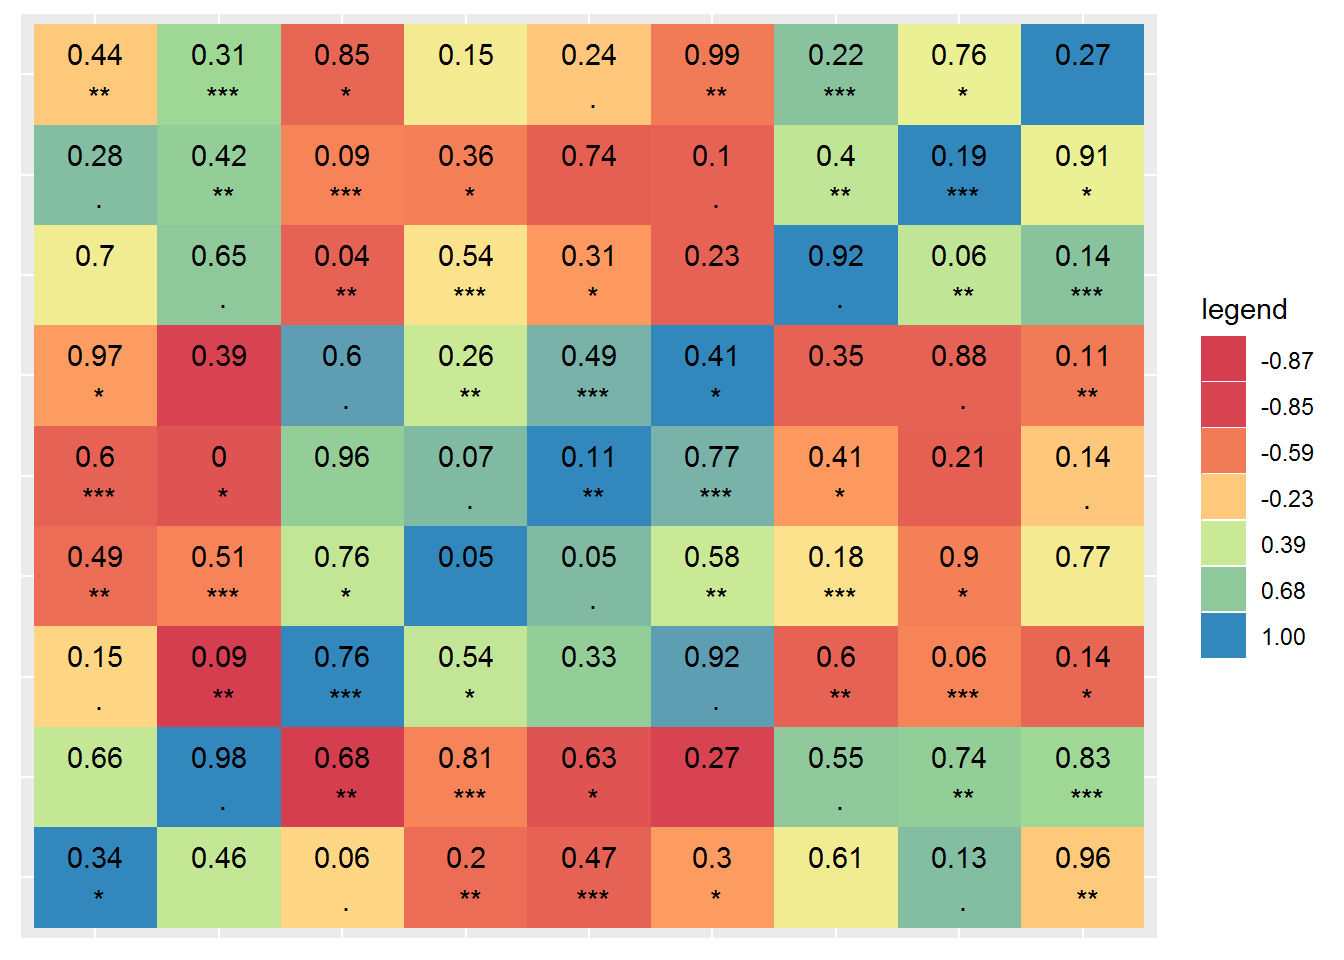
当然,也可以对之前的示例mydata上添加随意的标签矩阵,而不是p值和显著性。

1
2
3
    # 生成9×9的随意标签矩阵
    label3=label2[1:9,1:9]
    heatmap1(mydata,type='data',df.label=label3,Nbreaks = 6)

heatmap相关图-任意标签

heatmap相关图-任意标签

通过上述示例可知,ggplot2包确实功能很强大,我自编的函数heatmap1()可以用于绘制遗传评估方面生成的遗传相关矩阵及其显著性,下回找个时间演示一下。

heatmap1()的具体代码如下:

  1
  2
  3
  4
  5
  6
  7
  8
  9
 10
 11
 12
 13
 14
 15
 16
 17
 18
 19
 20
 21
 22
 23
 24
 25
 26
 27
 28
 29
 30
 31
 32
 33
 34
 35
 36
 37
 38
 39
 40
 41
 42
 43
 44
 45
 46
 47
 48
 49
 50
 51
 52
 53
 54
 55
 56
 57
 58
 59
 60
 61
 62
 63
 64
 65
 66
 67
 68
 69
 70
 71
 72
 73
 74
 75
 76
 77
 78
 79
 80
 81
 82
 83
 84
 85
 86
 87
 88
 89
 90
 91
 92
 93
 94
 95
 96
 97
 98
 99
100
101
102
103
104
105
106
107
108
    #' Create a Heatmap
    #' 
    #' Function creates a correlation heatmap using ggplot2 given a data.frame
    #' 
    #' @param df A data.frame or matrix containing only numeric data.
    #' @param type Identify df to be 'matrix'(default) or 'data'.
    #' @param df.label A matrix for heatmap labels.
    #' @param gtitle guide or legend title.
    #' @param Nbreaks A number controls legend breaks.
    #' @param Sig Logical, if TRUE put pvalue and sig level for heatmap labels. 
    #' @param data.only Logical, if TRUE returns correlation and pvalue.

    heatmap1 <- 
      function(df,type='matrix', df.label=NULL,gtitle=NULL,
               Nbreaks=NULL,Sig= FALSE,order=FALSE,
               data.only = FALSE) {  
        require(ggplot2) # ggplot2
        require(reshape2) # melt data
        require(agricolae) # count corr and p.value
        
        reorder_cormat <- function(cormat){
          dd <- as.dist((1-cormat)/2)
          hc <- hclust(dd)
          cormat <-cormat[hc$order, hc$order]
        }
        
        if(is.null(gtitle)) gtitle<-'legend'
        
        if(type=='data') {
          #dNN=nrow(df)
          df.cor.p<-correlation(df)
          df1<-df.cor.p$correlation
          df1.p<-df.cor.p$pvalue#-diag(dNN)
          
          if(order==TRUE){
            df1<-reorder_cormat(df1)
            nm1<-rownames(df1)
            df1.p<-df1.p[nm1,nm1]
          }
        }
        
        if(type=='matrix') df1<-df
        
        if(type=='corr.matrix') {
          df1<-df
          if(order==TRUE){
            df1<-reorder_cormat(df)
            nm1<-rownames(df1)
            if(!is.null(df.label)) df.label<-df.label[nm1,nm1]
          }
        }
        
        test <- melt(df1)
        
        if(type=='data'){
          test$p.value<-round(melt(df1.p)$value,2)
          ra<-abs(test$p.value)
          
          NN<-nrow(test)
          prefix<-rep('',NN)
          for(i in 1:NN){
            if(ra[i]<=0.1)    prefix[i] <- '.'
            if(ra[i]<=0.05)   prefix[i] <- '*'
            if(ra[i]<=0.01)   prefix[i] <- '**'
            if(ra[i]<=0.001)  prefix[i] <- '***'
          }
          ra1<-paste(test$p.value,prefix,sep='\n')
          test$rp<-ra1
        }
        
        if(is.null(df.label)) {
          if(Sig==FALSE) test.label=round(test$value,2)
          else test.label<-test$rp
        } 
        if(!is.null(df.label)) {test1<-melt(df.label)
        if(is.numeric(test1$value)) test.label<-round(test1$value,2)
        else test.label<-test1$value
        }
        
        p1<-ggplot(test,aes(x=Var1,y=Var2,fill=value,label=test.label))+ 
          geom_tile() + 
          geom_text() +
          labs(x="",y="",fill=gtitle)
        
        if(is.null(Nbreaks)) p1<-p1+scale_fill_distiller(palette="Spectral",
                                                         trans = "reverse",
                                                         guide = "legend")
        
        if(!is.null(Nbreaks)) { 
          bv<-unique(test$value)
          bv<-bv[order(bv)]
          Nbv<-length(bv)
          nn<-seq(2,Nbv-1,by=Nbreaks)
          bv1<-bv[c(1,nn,Nbv)]
          bv2<-rev(bv1)
          
          p1<-p1+scale_fill_distiller(palette = "Spectral", 
                                      trans = "reverse",
                                      breaks = bv1,
                                      guide = "legend")
        }
        
        
        if(data.only) {
          return(test)
        }
        print(p1)
      }